|
Traction analysis of hydro mechanical transmissions - Example: single-motor transmission
Example:
s
ingle-motor transmission.
Let's consider as an example a wheel loader with hydro mechanical transmission (Fig. 3). Input data and zero approach are presented in the tabulated form on Fig. 4, and results of calculation in the tabulated form – on Fig. 5
а
and in the graphic form – on Fig. 5
б
.
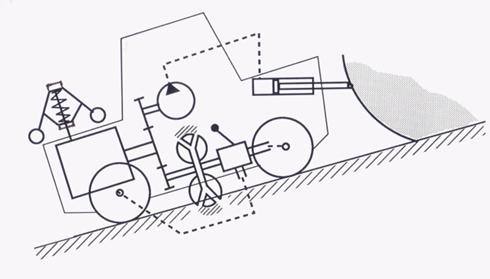
Fig. 3. A wheel loader with hydro mechanical transmission
Input data
Quantity of engines
=1
Traction for
се
:
Т
min
= 0 N,
Т
max
= 78400 N, a step of a traction force increment
Δ
T
= 4900 N
Machine
:
G
= 105000 N,
φ
= 0.1
Diesel engine
:
M
z
= 490 N·m,
k
r
= 86887 N,
а
= 0.0255 N·s
2
,
b
= 0.8535 N·s
2
/m,
c
= 56113 N/m,
F
= 801.5 N,
z
max
= 5.6 mm
Hydraulic torque converter
:
D
= 0.34 m,
k
п
= 0 N·m·s,
М
0
= 98.1 N·m,
u
en
= 0.85
Wheel propeller
:
r
w
= 0.75 m,
u
mech
= 71.8,
η
mech
= 0.9
Characteristics of transmission elements
Diesel engine
External characteristic (without considering M
z
)
|
М
(
ω
e
), N·m
|
49.05
|
58.86
|
63.765
|
68.67
|
68.67
|
63.765
|
49.05
|
29.43
|
14.715
|
0.00
|
|
ω
e
, rad/s
|
115.0
|
120.3
|
125.6
|
136.0
|
146.5
|
157.0
|
167.5
|
178.0
|
186.0
|
192.7
|
Hydraulic torque converter
Pump wheel
|
10
4
·
ρλ
1
(
i
), N·s
2
/m
4
|
274.68
|
289.395
|
294.30
|
289.395
|
274.68
|
255.06
|
225.63
|
161.865
|
73.575
|
-132.435
|
|
i
|
0.0
|
0.1
|
0.2
|
0.3
|
0.6
|
0.7
|
0.78
|
0.9
|
0.95
|
10.0
|
Turbine wheel
|
10
4
·
ρλ
2
(
i
), N·s
2
/m
4
|
794.61
|
667.08
|
588.60
|
490.50
|
328.635
|
268.794
|
213.858
|
128.511
|
36.788
|
-132.435
|
|
i
|
0.0
|
0.1
|
0.2
|
0.3
|
0.6
|
0.7
|
0.78
|
0.9
|
0.95
|
10.0
|
Wheel propeller
Slipping curve
|
δ
(
R
), %
|
0.0
|
10.0
|
20.0
|
30.0
|
40.0
|
50.0
|
60.0
|
70.0
|
80.0
|
100.0
|
|
R
, kN
|
9.32
|
53.955
|
68.67
|
73.575
|
78.48
|
80.933
|
83.385
|
86.328
|
88.29
|
89.271
|
Zero approach
(
at
Т
=
Т
min
)
|
ω
e
,
rad
/
s
|
z
,
mm
|
M
с
,
N
·
m
|
i
,
–
|
ω
p
,
rad
/
s
|
ω
t
,
rad
/
s
|
М
t
,
N
·
m
|
R
,
kN
|
δ
,
%
|
v
,
m
/
s
|
|
185.0
|
2.22
|
212.9
|
0.95
|
218.0
|
207.0
|
109.6
|
10.5
|
0.0
|
2.16
|
Fig. 4. Input data and zero approach
Results of traction analysis of single-motor transmission
Table
1.
|
Т
,
kN
|
ω
e
,
rad
/
s
|
z
,
mm
|
M
с
,
N
·
m
|
i
,
–
|
ω
p
,
rad
/
s
|
ω
t
,
rad
/
s
|
М
t
,
N
·
m
|
R
,
kN
|
δ
,
%
|
v
,
m
/
s
|
|
0.0
|
183
.
6
|
2.13
|
322.8
|
0.936
|
216.0
|
202.1
|
121.8
|
10.5
|
0.26
|
2.11
|
|
4.9
|
181
.
7
|
1.46
|
385.5
|
0.919
|
213.8
|
196.4
|
178.7
|
15.4
|
1.36
|
2.02
|
|
9.8
|
179.7
|
0.78
|
448.1
|
0.901
|
211.4
|
190.4
|
235.7
|
20.3
|
2.46
|
1.94
|
|
14.7
|
178.1
|
0.27
|
496.3
|
0.855
|
209.6
|
179.1
|
292.6
|
25.2
|
3.56
|
1.80
|
|
19.6
|
170.3
|
0.00
|
534.3
|
0.785
|
200.4
|
157.4
|
349.5
|
30.1
|
4.66
|
1.57
|
|
24.5
|
161.4
|
0.00
|
548.2
|
0.694
|
189.8
|
131.8
|
406.4
|
35.0
|
5.76
|
1.30
|
|
29.4
|
156.9
|
0.00
|
554.3
|
0.601
|
184.7
|
111.0
|
463.4
|
39.9
|
6.86
|
1.08
|
|
34.3
|
155.8
|
0.00
|
554.8
|
0.517
|
183.3
|
94.7
|
520.3
|
44.8
|
7.96
|
0.91
|
|
39.2
|
154.7
|
0.00
|
555.3
|
0.430
|
182.1
|
78.3
|
577.2
|
49.7
|
9.05
|
0.74
|
|
44.1
|
153.6
|
0.00
|
555.8
|
0.341
|
180.8
|
61.6
|
634.2
|
54.6
|
10.47
|
0.58
|
|
49.0
|
152.8
|
0.00
|
556.2
|
0.274
|
179.8
|
49.3
|
691.1
|
59.5
|
13.80
|
0.44
|
|
53.9
|
152.3
|
0.00
|
556.4
|
0.227
|
179.2
|
40.6
|
748.0
|
64.4
|
17.13
|
0.35
|
|
58.8
|
152.2
|
0.00
|
556.5
|
0.178
|
179.1
|
31.9
|
805.0
|
69.3
|
21.40
|
0.26
|
|
63.7
|
152.8
|
0.00
|
556.2
|
0.130
|
179.8
|
23.3
|
861.9
|
74.2
|
31.40
|
0.17
|
|
68.6
|
153.5
|
0.00
|
555.9
|
0.090
|
180.6
|
16.3
|
918.8
|
79.1
|
42.80
|
0.10
|
|
73.5
|
154.5
|
0.00
|
555.4
|
0.064
|
181.7
|
11.6
|
975.8
|
84.0
|
62.33
|
0.05
|
|
78.4
|
155.4
|
0.00
|
555.0
|
0.039
|
182.9
|
7.1
|
1032.7
|
88.9
|
94.00
|
0.004
|
Except for calculation of main parameters entering into the equations (1), for each value
of traction force
T, kN
, the program calculates some additional values: the engine power
N
e
, kW
; the hydraulic torque converter pump wheel power
N
p
, kW
; traction power
N
T
, kW
; efficiency of the hydraulic torque converter
η
; traction efficiency
η
T
; fuel
consumption
G
f
, kg/h
. These rezults have been presented in Tab.2.
Table
2.
|
Т
,
kN
|
N
e
,
kW
|
N
p
,
kW
|
N
T
,
kW
|
η
,
-
|
η
T
,
-
|
G
f
,
kg
/
h
|
|
0.0
|
59.3
|
41.3
|
0.0
|
0.60
|
0.00
|
16.8
|
|
4.9
|
70.0
|
52.2
|
9.9
|
0.67
|
0.19
|
19.2
|
|
9.8
|
80.5
|
62.9
|
19.1
|
0.71
|
0.30
|
21.8
|
|
14.7
|
88.3
|
70.9
|
26.6
|
0.74
|
0.37
|
23.8
|
|
19.6
|
91.0
|
74.3
|
30.7
|
0.74
|
0.41
|
23.0
|
|
24.5
|
88.4
|
72.6
|
31.8
|
0.74
|
0.44
|
21.9
|
|
29.4
|
86.9
|
71.6
|
31.8
|
0.72
|
0.44
|
21.3
|
|
34.3
|
86.4
|
71.1
|
31.3
|
0.69
|
0.44
|
21.2
|
|
39.2
|
85.9
|
70.8
|
29.2
|
0.64
|
0.41
|
21.0
|
|
44.1
|
85.4
|
70.3
|
25.4
|
0.56
|
0.36
|
20.9
|
|
49.0
|
85.0
|
70.0
|
21.8
|
0.49
|
0.31
|
20.8
|
|
53.9
|
84.7
|
69.8
|
19.0
|
0.44
|
0.27
|
20.7
|
|
58.8
|
84.7
|
69.7
|
15.4
|
0.37
|
0.22
|
20.7
|
|
63.7
|
85.0
|
69.9
|
10.7
|
0.29
|
0.15
|
20.8
|
|
68.6
|
85.3
|
70.2
|
6.7
|
0.21
|
0.095
|
20.9
|
|
73.5
|
85.7
|
70.6
|
3.4
|
0.16
|
0.05
|
21.0
|
|
78.4
|
86.2
|
71.0
|
0.4
|
0.10
|
0.005
|
21.1
|
а
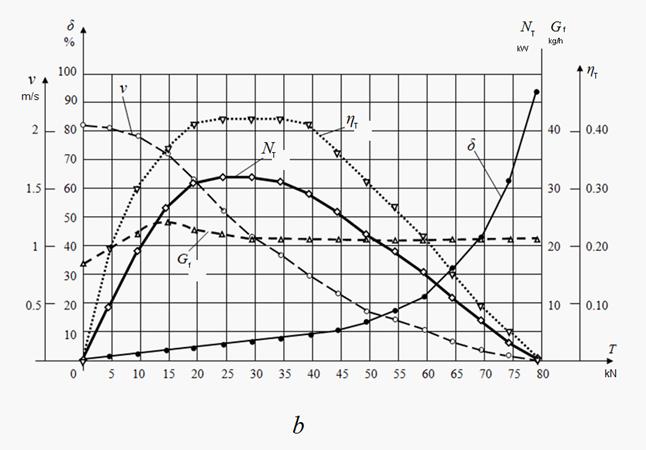
Fig. 5. Results of calculation of the traction characteristic of a wheel loader
а
– table form,
b
– graphic form.
|